Friday, 7 June 2013
2 Speculative Issues
Recently I bought shares in 2 speculative issues. For me this represents a rather dramatic departure from my usual buys. Maybe writing this blog has encouraged me to diversify my interests.
They are:
1) Genworth Financial - The Symbol is GNW on NYSE. GNW is primarily involved with mortage insurance in the US, Canada and Australia. This stock is basically a turnaround story. With a new CEO the company is slowing making a comeback based on the turnaround in the US housing market. They reported solid profits in the latest quarter with good forward guidance. The forward earnings is about $1.40 per share for 2014 giving a forward P/E of 7.5. Yesterday the company announced cost cutting measures. Recently the rating agencies upgraded the company.
2) Essential Energy Services Ltd. The symbol is ESN on TSX. The company is an oilfield service company located in western Canada. I bought this stock based mainly for the financials. The dividend yield is a very nice 3.8%. Forward earnings for 2014 is $0.36 for a P/E of 7.2. Obviously, the company is vulnerable to the oil markets. Reviewing all the reports gives me the impression of a good management team. The stock trades less than $5 per share which is riskly by my standards.
Thursday, 6 June 2013
Today's Chess Problem June 6 2013
Today's Chess Problem
June 6 2013
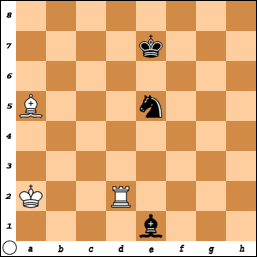
White to Play and Win
1. Re2 Bg3 2. Be1 Bf4 3. Re4 Bh2 4. Bf2 Ke6 5. Rh4 Nf3 6. Rh3++
1. Re2 Bg3 2. Be1 Bf4 3. Re4 Bh2 4. Bf2 Ke6 5. Rh4 Nf3 6. Rh3++
Wednesday, 5 June 2013
Today's Chess Problem June 5 2013
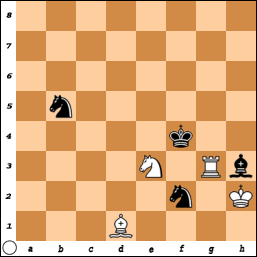
Today's Chess Problem
June 5 2013

White to Play and Win
1. Ra1 Bb7 2. Ra5 Bc8 3. Be2 Nc7 4. Rc5 Ba6 5. Bh5 Ne6 6. Rc6 Ng7 7. Rf6+ Kg8 8. Bf7++
Bill Ackman and CP in the News (and Hedge Funds)
I see in the Financial Post that Bill Ackman is selling 30% of his stake in CP Rail. See CP Rail. Why is he selling now? Beats me. There could be many reasons. An obvious reason is to take some profits after a huge runup in the stock.
If my memory has not deserted me this whole CP/Ackman adventure began in mid 2011. Here is the latest chart of CP Rail. I will also include CN Rail just for reference.


Since late 2011 CP has advanced from the $50's to over $120 per share. That looks like over a 100% gain (dividends excluded) over 1 1/2 year period to me. Ackman claims he tripled his money so there appears to be a discrepancy there. In any case it is a very nice return. From the stock price movement I would conclude Ackman, Harrison and the CP team deserve a great deal of credit here. Keep in mind the market and CN Rail have also done quite well. CN is up about 55% over the same time period. Currently CP has a high P/E (over 40) but does have a strong earnings forecast into 2014. My source GlobeInvestor Gold) has an EPS at $7.86 for 2014. Thus, the forward P/E is about 16. In the most recent quarter the company reported excellent results at $1.24 per share. Revenues were up about 9%. The operating ratio dropped to 75.8%.
What are the long term propects? Obviously, I don't know for sure but I do NOT see a natural competetive advantage for CP - in fact maybe the reverse in true (based on the rail routing). Over the long haul I see mean reversion between the two companies. I realize that's not a difficult call to make. Right now CP (and CN) are doing well due to the shipment of oil by rail car from the Bakken oil field in North Dakota and the oil sands in Alberta.
A couple of days ago RBC downgraded CP based mainly on valuation metrics. On the other hand I just read a piece that JP Morgan forecasts $12.50 per share in 2016 and a $200 share price - that seems optimistic to me. At some point we will have a recession. I cannot prove it but it looks like there is a lot of hot money in this stock (momentum players). That worries me and I stay away.
Has Pershing the hedge fund and Harrison added value? After a couple of years I think the answer is clearly yes. Many established Canadian companies have a disease which I refer to as CountryClubitis - this is a malady that seems to affect the most established of blue chip companies (and government). Ackman and Harrison broke the pattern and brought value to the shareholders.
BTW, Ackman in recent years has had some mis-adventures in JC Penny and Herbalife. I don't know much about those investments other than he did not do well (so far). The CP play should ease the pain.
The whole thing with CP/Ackman started me thinking about hedge funds in general and their performance and so on. When I first started getting involved in the markets in the mid 80's hedge funds were viewed as high risk speculative investments. They were mainly an investment vehicle for the wealthy who could afford the fees and also afford the potential losses. (BTW, if you need a backgrounder in hedge funds please see this article Hedge Funds: Past, Present and Future here. or for a more basic explanation see the web site Investopedia here) Nowadays they seem to have evolved to be an "alternative" investment. Even pension funds are investing in hedge funds.
I find the whole hedge fund issue an interesting area of investigation. Do hedge funds outperform the market? Do they have an intrinsic advantage over other market participants? Are hedge funds worth the high fees they charge? Does their collective actions threaten the economy as a whole? Maybe in a future post I might look at these issues.
Disclosure: I have no position in CP or CN (or Pershing Square)
Tuesday, 4 June 2013
Book Review - Winner Take All
I just finished Winner Take All by Dambisa Moyo published in 2012. Amazon here.
I was over at Indigo the other day and I saw the book in the investment section. I generally don't go for this kind of book but I figured what the hell. The book is focused on the China effect on the global commodity markets. The book is relatively easy read at just over 200 pages.
To be blunt this book is a decent read but nothing more. The first 200 pages or so concentrate on the many issues around global commodity markets. The emphasis is on the China influence. Many facts and figures are quoted to back up the author's point of view. The author also covers basic workings of the commodity markets including the futures markets. One issue the author does not cover is the leverage employed in the commodity markets. This is an important economic factor. There are huge amounts of borrowed money at work. Trying to figure out how this factor plays out over the coming decades is very difficult (BTW, that is the main reason I generally stay away from commodities).
The problem with economics books is that eventually you will hear the ideological view of the author. This becomes clear in last chapter(s) of the book. If I understand correctly he would like to see a massive collectivist type of action on a global scale to deal with the commodity "imbalances". To quote the author "This fight is about life or death".
Give me a break. This book reminds me of the doomster books that came out at the end of the late 1970's. I lived through that commodity boom and the world turned out just fine. As far as I remember there was never any collectivist action to "correct" commodity markets. The market was essentially left to its own.
While I have sympathy for many of the views of the author I am skeptical of many of his suggestions. Global collectivist actions is like herding cats - in theory it might be done but very difficult to achieve.
Today's Chess Problem June 4 2013
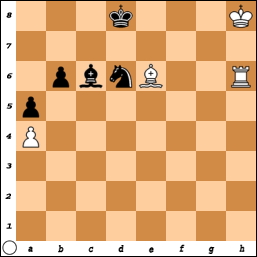
Today' Chess Problem
June 4 2013
White to Play and Win
1. Rf3+ Ke4 2. Rxf2 Kxe3 3. Re2+ Kd3 4. Re8! Bf1 5. Rf8 Be2 6. Rd8+ +/-
S. Isenegger 1947
S. Isenegger 1947
Monday, 3 June 2013
Reader's Digest June 3
Some interesting reads this afternoon:
Social Security on Econbrowser
Are You too Smart for the Stock Market?
Slow Start (Tim Duy's Fed Watch)
Swedish Housing - 140 years to pay off the mortgage
Doyle Brunson and Investing
Currency Wars - Peterson Institute
Jeff Saut Weekly Commentary
Pershing to Sell 30% Stake in CP
Sunday, 2 June 2013
Today's Chess Problem - June 2 2013
Today's Chess Problem
June 2 2013
White to Play and Win
Solution: 1. Bd5 Ba8 2. Rg6 Bb7 3. Rxd6+ Ke7 4. Bxb7 Kxd6 5. Ba6 ++
J. Marwitz 1941
J. Marwitz 1941
10 Year Yields Are Up and Readers Digest
In case you have not noticed 10 year yields have gone up over the last month or so. It is probably the hottest subject on the investing net right now.
Here is a chart of the US 10 year note over the last year:

However, it does not look like a big deal when viewed over the last 5 years:

The Japanese 10 year is also acting spastically:

The Canadian 10 year is also up a lot (from Bank of Canada):

In nominal terms the moves in 10 year yields are not that large as can be seen in the charting. In raw percentage terms the moves are substantial. The Canadian move is about 25% is percentage terms. Pretty big move considering it is only 1 month. The reason is clear. The FED will be easing off the gas pedal soon and the market is front running this information. Higher interest rates will probably an effect on the real estate market although other sectors are vulnerable as well (such as the consumer).
For me the more important question is how far can this bond move go and what impact will it have on the stock market? The worst bond move I have ever seen coming out of a recession is the 1994 "correction". Bond yields went from about 5.5% to 8% over the course of 10 months. Here is a chart from FRED:

How did the stock market do over the same period (1994):

The S&P 500 was basically flat for the year which is how I remember it. A significant rise in interest rates can certainly have an adverse effect on the economy but I am not going out and selling any stocks. Usually the only time I sell is if I find something good to buy and I need the money or if I think a recession is coming.
Speaking of recessions the Federal Reserve of Cleveland has a great web-site for following recession type indicators:
Cleveland Federal Reserve - Financial Stress index
Basically the stress index is a composite measure of yield spreads. Right now they are indicating virtually no risk of recession. I check into this site about once a month.
Another web-site I visit about once a month is the Philadelphia Fed where I find the Aruoba-Diebold-Scotti Business Conditions Index.
Philadelphia Fed - ADS Index
The ADS index bounces around quite a bit and is more focused on economic indicators. Right now it is neutral.
Of course the main Leading Indicators are published by the Conference Board but they are copyright protected. Also the ECRI (among many others) has a weekly leading index which is free to view.
Some interesting reads over the weekend:
Bob McTeer on Bank Reserves
Calafia Beach Pundit on Corporate Profits (Marty says be careful when investing based on long term charting). Good blog.
Jason Zweig at the WSJ (Scary stuff. Do not buy on margin and use limit orders!)
Sober Look - Emerging Market Review and etc. (good site in my opinion).
John Mauldin on Japan (this is a good one on Japan by Mauldin)
Bonddad on Weekly Economic Indicators (Bondad is a good site but be careful - don't get lost in the forest).
Wells Fargo on Canadian Economy
Wells Fargo - US Capital Flows and the Dollar
Learn Bonds - Good Overview of US Bond Market
Tuesday, 28 May 2013
Thoughts on SNC Lavalin
The purpose of this post is to provide my current thinking on SNC Lavalin. As usual do not take this as investment advice. I have no financial or working relationship with either SNC or STN.
Before I get too far I would like to point out that I am NOT a current shareholder of SNC and based on what I see I do NOT intend to buy the common shares in the near future (weeks). If I change my mind I will let you know.
A long time ago I decided I would make a significant investment in an engineering company. The idea was simple. I had a background in engineering and markets and I would lever this idea to get good returns from an industry that I understand. At the time my choice, as I saw it, was limited to 2 companies. These were Stantec (STN) and SNC Lavalin (SNC). I decided to invest in STN due to a number of reasons - better management, transparent operations and probably most important better valuation. SNC, it seems, was always too highly valued in my opinion. It would appear I made the correct choice.
I should point out a key difference between SNC and STN. SNC is a much larger company than STN. SNC is around $8 billion in sales while STN is about $1.8 billion revenue. In capitalism larger is quite often "better". Larger companies command a powerful market presence and often have pricing power. That being said larger companies require more effort and skill to manage. Finally, there might be a market distortion at work here. Larger funds such as CPP or OTPP that want some engineering exposure in Canada have little choice but to invest in SNC. This fact, of course, is hard to prove.
In my investing philosphy I mention that I stay away from situations with storm clouds. Over roughly the last 2 years SNC has endured a massive hurricane of bad news. It never seems to end. The CEO has been arrested and numerous charges/allegations have been made over many incidents. It includes domestic and international operations. They have a systemic problem. This has not been an isolated problem such as the Walmart problems in Mexico a couple of years ago. I will not dwell on the specific issues - you can easily Google all the problems.
Here is a recent chart of SNC:

Over the last 2 years the stock has declined from the high $50's to about $41 today. Ouch.
Looking over the recent company information the following points are significant to me:
- Top line revenue has actually increased from 2010 (6.3B) to 2012 (8.1B). This is good news but was factored into the backlog. Large projects have long time-lines and they are just working off the backlog. Note that a large part of SNC's revenue comes from concessions such as Altalink (Alberta electrical transmission) and the 407 highway just outside of Toronto. These provide a steady income to SNC and I would think they are nice asset to have right now.
- The net income figures have declined dramatically since 2010. I have $2.89 in 2010 and $2.05 in 2012 (per annum figures ending in Dec). Profits are down as they sort out this mess. The company did take 2 significant project charges against earnings. $32M for a local infrastructure project and $17M against a Latin America mining project. SNC has indicated that they will try to recoup this money. The EPS figures are from Globe Investor Gold. SNC figures are slightly higher.
- The forward guidance for annual sales is around $10B. This is a flat projection. Steady customers will likely stay around with SNC while new orders will likely be impacted negatively. The impact is unknown in my opinion.
- The company is looking to sell some assets (or partner up) according to their Q1 2013 report. I am not sure why they are doing this. When I listened to the conference call this specific question was asked and I still don't get a clear picture. SNC talked in somewhat vague terms - maybe they want to keep their options open.
- Last Wednesday the company got a credit downgrade from Standard and Poor's. In my opinion the market has already discounted this news. The rating remains investment grade.
- The company has responded to all the problems by coming forward with a comprehensive program for reform. Ethics, compliance and governance are all very nice but bad things have been done by bad people. The market needs, above all other considerations, that the bad people are gone and the problems are also gone for good.
- Analyst EPS forecasts for SNC into 2014 are at the $2.30 level. Lately the EPS estimates have been coming down. I always think EPS forecasts have a positive bias anyways. The forecasted 2014 P/E is approximately 18. This is a depressed number since earnings are down. I generally like to see a multiple at the market level or below. I also like to see EPS estimates increasing. In other words I would like to see the company exceeding expectations. For me this is close to the holy grail of investing.
- So far the dividend remain intact. Needless to say this is good news.
- A big question that remains is the extent of their total liability from all the negative events over the last 2 years.
This stock is not for me at this time. It is too speculative for me. If the stock was trading materially lower I might change my mind. The company on an intrinsic basis remains a strong enterprise with many good people. The brand has been seriously damaged and management must rebuild that brand. This will take 3-5 years in my opinion.
Monday, 27 May 2013
More on Japan
Looks like I am late to the party as usual.
Asymetric risk is the way I see it. Why now?
Zerohedge
John Mauldin
Japan Economy watch
Mish Global
Asymetric risk is the way I see it. Why now?
Zerohedge
John Mauldin
Japan Economy watch
Mish Global
Sunday, 26 May 2013
Some Books I Have Read
I read a lot. Lately I have been lazy but in the last few days I have read a few books. Here is a quick summary:
- How to Make Money with Junk Bonds - Robert Levine - 2012. Amazon here. I am not sure why I bought this book since I didn't really have any intention of getting into junk bonds. Maybe I will change my mind. Unfortunately there are very few books written on junk bonds for the average investor and probably for good reason. Junk bonds, as the name implies, is a bond of very low quality. Some junk bonds are rated CCC which is pretty much bankrupt. The book goes over basic background information on junk bonds. The author explains his investment technique which he calls the STRONG HORSE method of investing. In order to invest in a specific junk bond security an investor has to conduct a VERY thorough credit analysis so I still don't think individual issues are for the average investor. If I were to get involved in this kind of thing I would go through an ETF or bond fund. In my opinion this book is basically a primer on what is really a complex subject.
- Inside Apple - Adam Lashinsky - 2012. Amazon here. If you are a close follower of Apple there is probably nothing new here. I am not an Apple junkie but I found this book an easy and friendly read. A few months ago I read Walter Isaacson's book on Steve Jobs so I already knew a lot of stuff on Apple.There is some interesting information on the other figures in Apple (besides Jobs). The book goes a bit into the secrecy of Apple but nothing is given away. This book tends to emphasize one of the problems with technology companies. A lot of research and development is done in secrecy so the shareholder has no idea what is going on. It is tougher to value a company like that. A decent book but nothing special.
- Trading Bases - Joe Peta - 2013. Amazon here. The author combines his interest for sports betting and his experience on wall street stock trading. The chapters on investing were rather scarce with new information (I knew it already). On the other hand if you are into betting baseball you might find this book quite interesting. For me this is not really an investing book.
- Forecast - Mark Buchanan - 2013. Amazon here. Finally a higher quality book. The author tries to make a case for changing the methods of economic forecasting that are currently used. This is important for government policy makers but it is easily applicable for financial market analysis. The current state of economic forecasting is not good - for example in 2007/2008 the Federal Reserve completely missed the financial crisis. The author reviews the current state of economic forecasting which he calls equilibrium analysis. Using his scientific background he then suggests that using weather forecasting systems, which are based on dis-equilibrium analysis, could represent a big improvement in forecasting ability. This book is heavy going at times and is not for everybody. There are no equations however some background in economic theory is useful. The problem I have with this book is the leap from physical laws to socio-economic laws. I am not sure you can simply take a weather forecasting system that is based on pressure, temperature, etc and use it for human activity. Nevertheless, a very interesting book.
Rogoff/Reinhart vs Krugman
Saturday, 25 May 2013
Paul Tudor Jones in the News
Friday, 24 May 2013
My American Stock List - Short Version
From the last few posts you might of thought I am an international investor. Nothing of the sort. There are many good quality companies in Canada and the US to invest in. I have never invested in Europe, Japan or any other exotic locale. The reason is simple. I don't know what is going on these countries. Maybe that will change one day.
I probably follow about 50 stocks in the US. Maybe more. Like everybody else I follow the blue chips and the better known names. My investment focus has always to get into stocks (businesses) that I understand. Remember that any stock listed here is NOT investment advice. Please refer to my disclaimer. These are stocks that I follow and buy/sell from time to time.
Here is a short list of stocks that are at the top of the list:
- The Timken Co. - Symbol is TKR on NYSE. For most engineers Timken needs little introduction. The company supplies bearings to the North American and Global markets.
- Fluor Corp. - Symbol is FLR on NYSE. Fluor is one of the largest engineering companies in the world.
- United Rentals, Inc. - Symbol is URI on NYSE. Over the last 15 years the highly fragmented construction equipment rental market has consolidated. URI has bought out most of the competition and created a multi billion company.
- Crane Co. - Symbol is CR on NYSE. Crane is a long time (1850's!) supplier of pumps, valves and fluid handling control devices. They operate in NA and globally.
- Parker Hannifin - Symbol is PH on NYSE. Parker is the world's leading supplier of motion control technology.
- Gardner Denver - Symbol is GDI on NYSE. GD is a leading supplier of air compressors and vacuum pumps. They operate globally and have been around since the 1850's.
- Pall Corp. - Symbol is PLL on NYSE. Pall is a leading supplier of filtration, separation and purification systems.
- Mettler Toledo - Symbol is MTD on NYSE. Mettler is a world leader in weighing systems for industry, laboratory and food retailing.
- Flowserve - Symbol is FLS on NYSE. Flowserve is a leader in manufacturing and designing fluid handling equipment such as pumps and valves. This is primarily for hard-to-handle fluids or corrosive fluids.
- Autodesk - Symbol is ADSK on Nasdaq. Autodesk is a leader in design software and digital content for the engineering and architectural industry. They have been in business since 1982.
- Fastenal - Symbol is FAST on Nasdaq. Fastenal is a leading supplier of hardware (bolts/nuts/screws/cutting tools/etc) to industry and construction. They deal mainly in the US and Canada but also have international operations.
- Jacobs Engr. Grp. - Symbol is JEC on NYSE. Jacobs is also one of the leading engineering companies in the world.
- Grainger W.W. - Symbol is GWW on NYSE. GWW provides operating supplies such as safety equipment to industry and institutions. GWW has a large supplier network that gives it market dominance.
- Terex Corp. - Symbol is TEX on NYSE. Terex is a leading manufacturer of construction cranes and aerial work platforms for industry and the mining sector.
- Flotek - Symbol is FTK on AMEX. Flotek is a supplier of specialty equipment to the oil and gas industry. They are also a supplier to the mining industry.
- Worthington Ind. - Symbol is WOR on NYSE. Worthington is a steel supplier with manufacturing capability and also a supplier of pressure cyclinders.
- Chicago Bridge and Iron - Symbol is CBI on NYSE. Chicago Bridge is a leading engineering and construction company.
- Manitowac - Symbol is MTW on NYSE. The company supplies aerial work platforms and cranes to industry and construction. It is also a supplier of food and beverage equipment.
Monetary Policy for Japan - Different Points of View
Followers of markets know that Japan has loosened their monetary policy over the last several months. The yen has fallen and the Japanese stock market has gone ballistic in 2013. It is up something like 60% since mid November.
I do not have a big opinion on this matter so I offer 2 different views by the econheads:
Here and here.
A weakening yen should be good for Japanese exporters but there are risks involved.
Here is a recent chart of the NK300:

I also found a recent paper by Christina Romer here
Poker and Financial Markets
Many years ago I used to play chess. At one time I was quite proficient at this game. Games have always fascinated me. I gave up chess many years due to the hard work that is required and the time involved. Nowadays I play backgammon and poker. Twice a year I will travel to the US to play backgammon (when I can). Poker is available at most major Ontario casinos so I will drop by once a month to make a donation.
One of the more interesting subjects to discuss is the similiarity between various games and financial markets. I am sure this subject has been broached before. Game theory is a whole area of study if I am not mistaken. Financial markets seem more like gambling games since participants are placing bets on human actions and organizations.
Out of all the types of games I have played I would say poker is closest to "playing" the financial markets. Poker is a game of unknown information whereas chess and backgammon the information is all known (you can see it)
Here are some playing rules for poker. Read it and it might sound familiar.
Rules for Poker:
- You should not play in the game unless you expect to win. If you decide to play in the game anyways expect to lose money over the long term to the house and the other players. Playing the game is not free. The house provides the game and they charge a fee for playing. There are many houses and you should look for the house with the lowest fees.
- If all the players are better than you then you should avoid the game. You must make an objective assessment of your ability to play the game.If you think you are a weaker player then try to bet on all the other players (index fund).
- Most of time the game is boring. You will be dealt a rotten hand which you must fold. Most of time you must do nothing. If you insist on playing too often you will be giving away money to the house and the other players.
- Once in a while you will dealt a very strong hand. Such hands are quite rare. When this happens you should enter the game with lots of money. You should enter the game since you are a mathematical favorite to win. Over long periods of time you can make lots of money with the rare strong hands. Therefore, it stands to reason that you must be very patient to wait for strong hands.
- If you are playing the game you must always be evaluating information as it becomes available. You must adjust your play to new information. If new information arrives that is bad news you must quit the game (fold).
- The game has mathematical laws which you should know and understand. Many actions in the game will tend to repeat themselves - often you can exploit this factor for financial gain. The game also has uncertainity due to human behavior. Generally speaking you should try to avoid situations with a great deal of uncertainity.
- You should evaluate the actions and tendencies of the other players in the game. Often you should play your hands contrary to the actions of the other players. For example, if the other players appear to be passive you should play aggressively.
- The game is constantly evolving. New players are coming into the game and existing players are leaving. New players often bring in new methods which must be evaluated. New methods can be attractive to follow and copy since they may be profitable for some time. This is usually because it takes time to adjust to the new methods. New players are often unfamiliar with game strategy. This creates what is known as information asymmetry - some players know the game and others do not. Often this factor can be exploited to make money.
- Most of the time the game is proceeding normally. However, once in a while the game goes beserk for some unknown reason. Human actions, it would appear, are somewhat unpredictable. Players are often drinking late in the game and this leads to unusual behavior. Situations can arise where players win or lose huge sums of money.
Thursday, 23 May 2013
Corruption in Southern Europe (Commentary)
I have always believed that one of the major problems in the Eurozone is the corruption in the southern bloc. I might know something about this matter having lived for 1 year in southern Europe. The people are wonderful but.....there are problems.
Nobody (in public policy) seems to emphasize the corruption problem. Here are a few articles that I Googled here, here, here and here. The articles are somewhat dated but still applicable in my opinion. There also seems to be a correlation between corruption and political extremism. Not a good situation.
Econheads still ramble on about austerity or further government borrowing instead of working the problem(s). See here.
If Europe does not start to address their structural problems look for economic problems to endure.
Investment Mistakes - Case Study HPQ (a whopper)
Today (just before close) Hewlett Packard is up $3.50 to almost $25 USD. Apparently their Q2 results were better than expected. For some reason that reminds me about one of my whoppers. BTW a whopper is a mistake, a double whopper is a big mistake and finally a double whopper with cheese is a gigantic mistake (losing lots of money).
Anyways, about 3 years ago - I think it was around mid 2010 I decided to buy a few shares of HPQ. I read the annual and quarterly reports. I probably surfed the net for various opinions. I ended up buying for me what was a fairly substantial position around $47-48. The main thing that attracted me was the high dividend yield which I think at the time was over 4% and the low P/E. I felt pretty comfortable since I "knew" Hewlett Packard for many years.
Shortly after my purchase the stock started to drop and I ended up selling out in the low 40's. What I had missed was the slide in the PC market due to mobile and the tablet invasion. I did not understand the industry thoroughly. My mistakes are:
- Insufficient research on the industry
- Superficial thinking - the high dividend yield and low P/E should have been a warning.
Disclosure: I do not own shares of HPQ. Please refer to my disclaimer.
Wednesday, 22 May 2013
Is the Market too High?
Here is a recent chart of the S & P 500 from approximately mid-November to present.

Since mid-November we are looking at a gain of about 25% (excluding dividends). A very nice run indeed. Many of the US companies that I follow have gone up a lot more than 25% making most of them too expensive.
Once in a while I still go to Barrons Market Lab to get a higher level view of valuation. Right now the DJI sports a P/E of 16.36 and a dividend yield of 2.35%. By comparison the S & P 500 Index has a current P/E of 19.27 with a dividend yield of 2.1%. Of course this is a static view - if we look forward the earnings will be slightly higher and the valuations will look better. The S & P 500 is usually the index I look at - it is much broader than the DJI. The valuations are no longer cheap and are getting to the high end of the range. My danger zone is usually over 20 for P/E all other things being equal. I realize interest rates are very low but will this always be the case? During the early stages of a business cycle recovery you can justify high P/E's since earnings are very depressed. This is not the case now. In my opinion we (US Markets) are slightly overvalued but not critical yet.
Investment Books - The Best of the Bunch in My Opinion
Every investment blogger has to have his "best books list". My list will include books that I think will make you a better investor. Some books I have not read in many years so the commentary will be light on some of them. For the most part I have left out major textbooks since they involve a lot more work. For example, Security Analysis by Benjamin Graham. This is a very serious textbook type of book. People go to college to study investing and use this book as their main course material. It is a very important investment book but probably not practical for most investors.
1) The Only 3 Questions that (Still) Count by Ken Fisher (2008/2012). Amazon here . Ken Fisher is a money manager who has been writing a column in Forbes magazine for over 25 years. I have been following him since the mid 80's. In my opinion he is very good. He has authored many books but I think this is his magnus opus. One of the main takeaway's I get from this book is to challenge conventional thinking. The chapters on high P/E's and high debt are worth the price of the book easily.
2) The Intelligent Investor by Benjamin Graham (1949 - 2006). Amazon here. Warren Buffett considers this book to be one of best books ever written on investing. Needless to say I agree. There have been several editions over the years - my latest is 2006. I believe the original edition was published in 1949 with many editions to follow. Graham died in 1976 and is an investing legend. He is a former Professor at Columbia Business School in New York City (one of his students was Buffett). His scientific approach to investing led to the development of the value school of investing. The main idea that I get from this book is what I refer to as the purist scientific approach. He applies a no-nonsense scientific/mathematical approach to investing whereas previously people had previously looked at the stock market as a casino. Graham said that a common share was a part ownership in a business enterprise and it should be evaluated accordingly.
3) Capital Ideas by Peter Bernstein (1992/2006), Amazon here. If you want an overview of financial theories over the last 50 years this is an excellent book. If you read this book you will hear names like Harry Markowitz, Fisher Black, William Sharpe and others. These folks developed academic theories on the stock market, investing and other finance topics. Many received Nobel prizes for their work. To be honest I am not sure that reading this book this will make you a better investor but it remains an important book nevertheless.
4) One Up on Wall Street by Peter Lynch (1989/2000). Amazon here .This investment book was originally published in the late 80's. While running the Fidelity Magellan mutual fund from the late 70's until he retired in 1991 Lynch compiled one of the most impressibve investment records of all time. This book was written for the masses. It is quite readable for the average investor. The book offers such good practical advice that it worth re-reading every 2-3 years just as a refresher. Lynch's commentary on types of stock investments are worth their weight in gold.
5) Winning the Loser's Game by Charles Ellis (1976/2010). Amazon here. This excellent book first came out in the mid 70's and has been updated several times. My latest edition is 2010. This book covers a number of investing issues from market timing to portfolio management and costs. Mr. Ellis is a long time investment professional. The main issue that I get from this book is the difference between institutional and individual investing.
6) Common Stocks and Uncommon Profits by Philip Fisher. Amazon here. Originally published in 1958 this book is available through Wiley Investment Classics. This book provides focus to the qualitative aspects of investing. Such issues as management quality, research and development, etc are reviewed. This book is quite readable for the average investor. Note that Phil Fisher is the father of Ken Fisher.
7) Fooled by Randomness (and The Black Swan) by Nassim Taleb. Amazon here. Both of these books have been published in the last dozen years. I am not sure that economic books make you a better investor but this book stands unique in my opinion. Taleb reminds us of the unknowable. This is an issue that Buffett has also supported. Taleb also attacks the economic and financial establishment for their reliance on mathematical models. An important set of books. In order to fully appreciate Taleb's ideas you probably need to read some economic primers beforehand.
8) The Battle for Investment Survival by Gerald Loeb (1935 - 2010). Amazon here. The book was originally published at the bottom of the Great Depression and was subsequently updated many times. Loeb was a big-time broker for E.F. Hutton back in the 20's and 30's. This book compiles many smallish chapters giving advice on investing. Loeb's approach differs from the buy and hold school. It is more closely related to momentum investing. There is a great deal of practical advice in this book that is still applicable today.
9) Common Sense on Mutual Funds by John Bogle (many/2009). Amazon here. There are a number of Bogle books on the market. Bogle is generally credited with the creation of the index fund in the mid 70's. He is probably the most feared man (or despised) on wall street. Throughout Bogle's writings he indicates that mutual funds are, over the long haul, relatively poor investments. This is due to costs and fees which remain too high. Bogle backs up his claims with statistical research over long periods of time. I am not certain that I agree with his position 100%. It is true that costs and fees are too high but his ideas imply a buy and hold investment strategy is best. I am not convinced that this true for small retail investors that know their way around markets.
10) Investment Fables by Aswath Damodaran (2004). Amazon here. If this book does not make you a better investor I am not sure what book will. Each chapter is dedicated to one specific investment concept that Damodaran reviews and often refutes. The main idea I get from this book is to keep an open mind to different investing ideas. Stay agnostic.
The above list is a brief list only. There are many other books that would rank a close second place. For example studying market history and asset bubbles is very important.
Canadian Real Estate Markets - Timing the Bubble
Over the last couple of years there has been great concern Canadian real estate is in a bubble and therefore due for a bust. Views on this issue can differ but there seems to be agreement that house prices have gone up too far. I know in my own case my house has almost doubled over the last 7 years. That is a compounding rate of almost 10%. This is far above the GDP growth rate of 2.5%. It stands to reason that there should be a correction at some time. When is the correction coming is the real question?
I have experienced 2 major real estate asset bubbles in my lifetime. The first was in the late 80's and early 90's in Canada. The 2nd bubble was the more recent US subprime bubble in 2007/2008. Both bubbles do have one common economic feature. Both of them took place at a business cycle peak while the yield curve was flat or inverted. In other words money was tight according to central bank policy. My guess is that this time will not be different.
The current Canadian Government bond yield curve is positive. See here for more info. For the time being we are probably OK. For more research go to CREA here or the CMHC here.
Do People Really Invest Based on Polls?
If you follow the business media sooner or later you will hear about some stock market sentiment surveys. These polls are usually developed by investment advisory companies or brokers. Investors are polled as to their view on the stock market - bull or bear or maybe correction coming. Some of them have been around for many years. There are also polls on national levels of consumer sentiment. The University of Michigan produces one such poll.
The investment idea is to survey current market opinion and then take a contrarian investment stance. For example, if the bullish reading was very high - say above some threshold like 85% you would open up your laptop (how do you open an ipad?) and trim down your portfolio. The 85% sentiment reading tells you folks have gone hog-wild in an asset bubble and you were smart enough to get out.
The whole thing sounds logical. Right? Unfortunately, while sounding attractive, the strategy does not work according to Meir Statman and Ken Fisher who published a research paper on this topic in 2003. Here is a link - Paper.
In my opinion it is silly to go out and buy/sell stocks based on some survey of random people. Should you invest in a business if the majority of folks are bullish (or bearish)? Investment polls are maybe fun to follow but they appear to be useless for trading or investing.
Sunday, 19 May 2013
This Time is Different and Europe (Commentary)
I recently re-visited the book This Time is Different by Ken Rogoff and Carmen Reinhart. See Amazon here . This book is back in the news lately due to the discovery of a cell error in a spreadsheet. See here. In case you are unaware this book became an economic sensation after the 2008 credit crisis. The book goes back in history and compiles an enormous amount of country specific data on GDP and debt. There is also the research paper Growth in a Time of Debt published by the same authors in 2010. There have been many books published on asset bubbles but this book appears to be unique due to the volume of data analyzed.
One of the conclusions that the authors reached is that economic growth slows down after the 90% debt/gdp threshold is reached. This is generally welcome news to conservative economists who favor reducing the size of government. On the other hand liberal economists are probably ticked off since they generally recommend increasing government spending (Keynes) during recessions.
Why does this all matter? How does it affect my investments? In my opinion it matters mainly due to the situation in Europe. In case you have not noticed Europe is in rough economic shape. Last week the Euro area reported GDP and it was down again making it down in the last 6 quarters. The only good news is that so far the declines have been relatively modest. See reports here:Euro Stats . I have been following the situation on and off over the last 3-4 years since mainly the Greece crisis took off. The problem, in my opinion, is not really Greece. Greece alone has a very small GDP relative to the Euro area. The main concern seems to be Italy and Spain followed by France. (One way to follow the latest news on the Euro crisis is to go here). So, what to do? If we were to follow Rogoff and Reinhart Europeans are due for a long period of low/no growth.
Another significant problem is the European banking system. According to Europe and the Financial Crisis by David Beim - Columbia Business School - 2009 many of the European banks were over-leveraged. Leverage ratio's over 30 times against owner capital for both France and Germany. Banks have bought European government bonds on the assumption that they are risk-free. They are not risk free and the banking system has required a re-capitalization. The European Central Bank (ECB) has stepped in to essentially bail the banks out (Do Whatever it Takes). This is essentially printing money (cyber money) which worries a great deal of people - especially in Germany.
The European situation is very complex both economically and politically. While I am not an expert in these matters it would seem that the Europeans need to consider debt forgiveness as a solution. Thisis the main take I get from This Time is Different. Sort of a Marshall Plan for debt management. I don't really see what else to do. Lately there has been some of talk of setting up a universal deposit insurance program but it is far from being approved. Socialization of losses is not pretty but it may be the best option out of many bad alternatives. Squeezing debtor countries with austerity is like trying to get blood from a stone. So far it seems that the Northern countries are against this idea since it essentially gives the Southern countries a free lunch. This is, of course, moral hazard here but the alternative might allow political extremism to take hold.
When the crisis was going full blast a couple of years ago I followed the Italian and Spanish 10 year bond rates here and here. If trouble is coming you will probably see it in the bond rates very quickly. Obviously you would follow the Euro currency as well. Lately the Euro is modestly weak against the dollar. See here:

The whole debate above assumes as an investor you would buy/sell securities based on economic information and interventionist policy. I am not really worried about modest declines in GDP - if that was the concern I would not be posting. The REAL concern for Europe is an economic implosion of debt deflation similiar to what we had in the great depression. So far they have avoided the worst.
Saturday, 18 May 2013
Thoughts on the The Commodity Supercycle
On the web and cable business TV there has been generally a lot of talk on the issue of the commodity supercycle. When you Google the item you get many reports pro and con. The balance of opinion does suggest that commodities are due for a pullback or worse. I don't think anybody knows for sure including me. If the commodity cycle is ending and rolling over it should happen over a relatively long period of time (read: years).
Just for reference here is a chart of the TSX going back a couple of years:

As you can see the TSX peaked out over 14,000 almost 2 years ago. It is currently around 12,500. So far that is about a 10% decline. The TSX has some 237 companies within the index according to their web-site. I am not ready to get into the commodity breakout in the index - suffice to say commodities have a high weighting in the TSX. My rule of thumb has been that commodities and financials make up 75% of the index.
I tend to agree with the folks that think the commodity supercycle is rolling over. This is based on the research that I have seen but also on anecdotal evidence (empty chinese cities). In the last 2-3 years I have been investing more in the US. If commodities are heading lower the CDN dollar should fall over time (many years). There should be a downward bias for the CDN dollar all other things being equal.
Friday, 17 May 2013
Keystone - Enough Already! (Commentary)
Yesterday Prime Minister Steven Harper was in New York speaking on bilateral issues. He was speaking at the Council of Foreign Relations. One of the main topics was the Keystone Pipeline Project through the US. PM Harper provided support for the project indicating that the positive aspects outweigh the negative.
Before I go further I must confess that I am not an oil and gas specialist. I do not follow the industry closely and to the best of my memory I have never invested in oil and gas (directly). One of the best ways to demonstrate my skepticism for oil investing is to provide a chart. Here is a chart of oil around 2008-09:

On the chart you see oil decline from $145 to below $40. Then back up to $70. These kinds of swings are heart stopping for me. It reminds me of the early 80's when oil collapsed. (and 1986). BTW please do not take this personally - the folks who manage the companies are very talented as far as I can see.
Anyways, back to the issue of Keystone. This project has taken on a gargantum life of its own. It has been going on for at least 2 years in the public domain. This project has a capital budget. Billions of dollars tied to thousands of jobs. I suspect that given all the time spent by politicians, TV pundits, analysts, environmental groups and other interested parties the cost of approving (or dis) will soon exceed the capital cost of the project. Well OK maybe I am exaggerating. Clearly US politicians need to make some decisions here. 2 years is long enough to decide.
Finally, if you want an explanation of why the economy is slowing down in growth this Keystone issue is a great example. Delays due to lack of political will and decision making will obviously slow down projects and the economy as a whole.
Thursday, 16 May 2013
Economic Forecasting and Investment Returns
Economic forecasting is a tough business. Does following economic information and adjusting your portfolio lead to superior returns? It is very tempting to try. Since WWII there have been 12 recessions according to the National Bureau of Research (NBER). The NBER is the official gatekeeper of the business cycle dates. Bear markets usually happen around recessions for the simple reason that the profits for companies decline significantly during recessions. Years ago (early 90's) I figured that if only I could predict recessions that I could avoid the bear market. Instead of the usual 10% return on stocks I would get higher returns. I was studying all sorts of data series and even entertained the idea of setting up a sophisticated econometric model. This was pre-internet and eventually I gave up since it was too much work.
Has following economic information helped my investment record? My results are probably positive over the long haul. In the 2001-2002 recession I was mainly in cash - stocks were also very highly valued during this period. I roughly broke even while the main US markets declined something like 40% plus. During the the 2008 crisis I must confess that I missed the whole thing. The yield curve was inverted in 2007 so I should of known better. I was basically 100% in stocks during 2008. I did outperform the markets though by a significant margin.
There are no economists in the Forbes 400 list of wealthiest people. If following economic information leads to superior investment returns you would expect to see at least a few people in the upper ranks. We see none as far as I can see. Needless to say views on this matter are divergent. Warren Buffett says he has NEVER used macroeconomic information in his decision making. BTW, this whole issue has a cult following of it's own. There are even web-sites dedicated to recession probablity forecasting.
Anyways, what are my views currently? I do NOT weigh economic information as highly as I used too. My views over the years have evolved. It is tough to predict the future. Always remember that the economic system is a COMPLEX ADAPTIVE SYSTEM. Rules that applied many years ago may not work now.
Where do we stand now in the business cycle? It hard to believe that we are headed for recession given the slack in the labor markets. Money is still easy due to FED policy making. The yield curve is positively sloped (ie. not inverted). My guess is that we are about half-way through the business cycle. In other words the stock markets have a way to go before the bear arrives.
I still follow a few economic indicators and I provide them below.
US 10 Year Treasury Bond Rate

US Nonfarm Payroll Data:

US Weekly Job Claims (4 week moving average):

Leading Index for the US (Fed Philadelphia):

US Industrial Production:

US ISM New Orders Index:

US Commercial and Industrial Loans (top 100 banks):

US B of A Merrill Lynch High Yield Master II Option Adjusted Spread:

US Government Bond Yield Curve:
http://www.treasury.gov/resource-center/data-chart-center/interest-rates/Pages/Historic-Yield-Data-Visualization.aspx
Tuesday, 14 May 2013
The Equity Risk Premium.
In this article by the New York Federal Reserve the equity risk premium is given some consideration to examine whether stocks are currently undervalued. See this: http://libertystreeteconomics.newyorkfed.org/2013/05/are-stocks-cheap-a-review-of-the-evidence.html
In the simplest form the equity risk premium is the yield difference between risk free treasury securities (bills, notes or bonds) versus either the current earnings yield on stocks or on the future expected return on stocks. In my opinion the treasury yield curve has been so warped by Fed buying of securities that the equity risk premium has probably become useless a predictor of returns (if it was ever a predictor in the first place!).
I have never used the equity risk premium to make an investment decision. It might be relevant to a pension plan manager who manages billions of dollars but to regular folks I think it is a red herring.
If you want to learn more about the equity risk premium go to Prof. Damodaran's website or blog. See here: http://aswathdamodaran.blogspot.ca/
Stocks on my Watchlist
Here is a quick summary of Canadian Stocks on my watchlist. I may be buying or selling any one of these stocks from time to time. I will also provide a very quick opinion of each stock. Remember that this is not investment advice - it is only my opinion. Always consult with a financial professional before investing.
- Aecon - Symbol is ARE on TSE. This stock is highlighted in another post. It is a construction company and therefore I understand what is going on. Over the years I have done well with this issue. Watch out for recessions - the stock can get hit hard.
- SNC Lavalin - Symbol is SNC on the TSE. This company is one of the great performers over the last 25 years. Needless to say it has been hit hard in the last few years from scandal. Every time I look closely at this company it is too highly valued. Wait and see situation. Too highly valued and too risky.
- Stantec - Symbol is STN on TSE. This stock is also highlighted elsewhere on this blog. It is a good steady performer. It has avoided the scandal stuff from SNC. In fact some money has probably come over. Great company and wonderful investment. One of the top performers on the TSE over the last 15 years. There is still growth left in my opinion.
- Toronto Dominion Bank - Symbol is TD on TSE. Needs little introduction. Major Canadian bank in business since buffalo roamed the plains. I like what they are doing in the US and they pay a decent dividend. You do not get rich with banks since they are heavily regulated. On the other hand they are relatively safe.
- Royal Bank - Symbol is RY on the TSE. Same comment as the TD bank. I have a slight preference for TD over RY but they are both good.
- Tim Horton's - Symbol is THI on the TSE. Just walk out the door and you will run into a Timmy's sooner or later. Currently a bit expensive. Expansion in the US has somewhat mixed results in my opinion. The Canadian market penetration is probably mature. Low volatility stock.
- Computer Modelling Group - Symbol is CMG on TSE. Have not owned this one in a couple of years. It seems like a very well managed company. It used to be an excellent dividend yield until everybody crammed into this issue. They provide computer (simulation) modelling for the oil and gas industry. Obviously their success is also tied to that industry. Strong competitive position and good management.
- Toromont - Symbol is TIH on the TSE. The stock is profiled elsewhere on this site. Good steady performer. Caterpillar dealership plus the CIMCO refrigeration business. Good dividend yield. I bought a few shares recently.
- Alliance Grain Traders - Symbol is AGT on the TSE. AGT is one of the reasons I am very wary of businesses that depend on commodity pricing. The company is based in Sasketchewan but does business globally. They source and process beans, pulse foods and also pasta. I bought it a few years ago and luckily got out when the plunge happened. Nevertheless the company is well managed and the stock is probably as low as it will go. I am watching this one closely. It is a thin trader so be careful - use limit orders only.
- Blackberry - Symbol is BB on the TSE (formerly Research in Motion). This stock needs little introduction. I bought it at the low 40's and got out in the mid 50's a few years ago. I have learned that when dealing with high tech stick with the dominant company if you can figure out who it is! I don't really have any intention to buy shares but it is still on my watchlist. One of the reasons that I stay away from high tech is that the long term propects are unknown. Currently I am with Apple but it is probably just a rental. Gadget companies are so finicky and fadish that it is hard to figure out where you stand. BB will probably survive but they are one product company now. Sell out to Microsoft I say.
- Alimentation Couche Tard - Symbol is ATD on the TSE. Great company in my opinion. I loaded up with this one a couple of years ago but down sized my position just before the move into Europe. I still did very well. A bit expensive right now - I am not in the stock. Quebec based business that provides convenience stores. Pretty much located all over the place including international. Almost a monopoly in Canada. I am watching for a pullback. Could be a long wait.
- Metro, Inc - Symbol is MRU on the TSE. I'm pretty sure I have never owned this one but it is on my watchlist. It is the kind of company that interests me. Food store operating under many brand names. Good return on equity. Very steady performer. The dividend yield is a bit low for my taste but I will wait and see.
- Russell Metals Inc - Symbol is RUS on the TSE. It seems that Russell Metals has been around forever. When I was an engineer 20 years ago I picked up my steel from their distribution warehouses. It is basically a good company with a strong balance sheet. The business is relatively simple but they have a good competitive position. The business is long term vulnerable - especially if they get into trouble.The stock usually pays a very good dividend. The yield is currently over 5%. On a short term basis the stock might be weak. The steel business is not doing well. Wait and see.
- Canadian Tire - Symbol is CTC on the TSE. I have never owned shares in CTC for some reason. Maybe the dual share structure worried me. They have a strong position in the rural cities but are vulnerable in the urban areas. The long term position is probably OK. Recently they are under position to divest holdings into a REIT structure. If it goes through it will give them some money. How they use the money is really the question (if it goes through). The company does provide a steady ROE and pays a small dividend (1.5%).
- CAE - Symbol is CAE on the TSE. This stock unfortunately is a rental only. They are a leading provider of aircraft simulation systems. CAE is a well managed company and has a strong competitive posiiton. Back in the 1980's I still remember making a nice chunk with the stock. It was one of my very first buys. One of the main problems with this stock is that the customers are the airlines. The airlines over the years has to be one of the worst performing sectors. The time to buy CAE is during a recession when (hopefully) the stock is well below $5.
In the future I will also provide an American list of stocks that I watch. Much bigger list!
Monday, 13 May 2013
Sell in May and Go Away. Is it for Real?
In the last couple of weeks I have seen a bunch of articles based on calendar investing. What the heck is calendar investing you ask? In the simplest form calendar investing is buying and/or selling of stocks based on some defined period of the year. It can also mean buying/selling based on the day of the week and even the time of the day.
Just for fun I thought I would take a closer look at this issue. For the record let me say that I do not support investing in stocks (or any other securities) on the basis of the calendar. It just seems like an irrational thing to do. I am pretty sure I have never invested based on what month or day it is and I have no intention of doing so in the future. Having said that I must confess that I have an intellectual curiousity to investigate further.
First of all I had to select a database. I selected the Dow Jones Composite Index from the St. Louis Federal Reserve FRED database. This gave me a daily index to analyze going back to 1934. I do have other indexes kicking around but I was a bit worried about copyright issues. Hopefully the Fed or Dow Jones will not come after me. Anyways, I downloaded the data into a spreadsheet and computed the monthly returns going back to 1934. I should point out that the index represents market action only. Dividends, taxes, transaction costs, etc are excluded. I am providing 3 tables below for reference (1934-2012, 1934-1974 and 1975-2012. I separate the main data table into 2 parts at 1975. This is roughly when commission de-regulation went into effect.
| Dow Jones Composite Monthly Returns 1934 - 2012 | ||||||||||||
| Jan | Feb | Mar | April | May | June | July | Aug | Sept | Oct | Nov | Dec | |
| 1934 | 12.33 | -3.42 | -1.05 | -1.69 | -7.85 | 2.52 | -13.16 | 4.85 | -0.08 | -1.62 | 7.34 | -0.40 |
| 1935 | -3.66 | -3.00 | -2.15 | 8.60 | 2.59 | 7.10 | 7.21 | 2.02 | 1.55 | 5.22 | 4.03 | 2.04 |
| 1936 | 6.76 | 2.21 | 0.70 | -7.34 | 5.74 | 3.34 | 6.76 | 1.07 | 0.72 | 5.48 | 0.41 | -2.27 |
| 1937 | 3.04 | 1.06 | 0.43 | -6.54 | -1.15 | -5.17 | 8.60 | -5.49 | -13.57 | -11.25 | -8.46 | -4.75 |
| 1938 | -1.34 | 6.06 | -26.25 | 13.15 | -2.96 | 28.76 | 5.37 | -2.37 | 0.66 | 11.03 | -2.93 | 5.40 |
| 1939 | -7.29 | 4.65 | -12.81 | -1.97 | 8.00 | -5.87 | 10.67 | -6.92 | 16.21 | -1.00 | -4.49 | 2.53 |
| 1940 | -3.44 | 0.51 | 1.16 | 0.08 | -22.61 | 8.11 | 2.93 | 2.36 | 1.73 | 2.27 | -4.28 | 0.11 |
| 1941 | -3.80 | -1.76 | 1.38 | -5.16 | -1.21 | 5.68 | 5.23 | -0.80 | -1.36 | -6.21 | -3.75 | -4.18 |
| 1942 | 1.22 | -2.30 | -8.24 | -3.76 | 3.97 | 2.12 | 2.86 | 0.88 | 3.29 | 5.59 | -1.42 | 3.72 |
| 1943 | 6.26 | 5.11 | 5.22 | 1.12 | 4.80 | 0.53 | -5.02 | 0.59 | 2.41 | -0.76 | -7.14 | 5.25 |
| 1944 | 2.93 | 1.01 | 1.96 | -1.96 | 4.29 | 3.78 | 0.70 | -1.13 | -0.27 | 0.53 | 1.14 | 5.78 |
| 1945 | 0.02 | 5.91 | -4.52 | 8.90 | 1.67 | 1.04 | -2.70 | 3.39 | 5.11 | 2.82 | 3.91 | -0.25 |
| 1946 | 6.80 | -7.16 | 4.90 | 2.55 | 3.17 | -3.13 | -3.04 | -6.40 | -11.31 | -0.18 | 0.60 | 4.15 |
| 1947 | 0.85 | -0.80 | -1.81 | -4.74 | -1.12 | 4.49 | 4.62 | -2.03 | -0.76 | 1.48 | -2.43 | 3.32 |
| 1948 | -2.75 | -4.25 | 6.53 | 3.55 | 5.29 | 0.44 | -4.02 | 0.80 | -2.63 | 5.12 | -10.63 | 3.04 |
| 1949 | 1.04 | -4.25 | 2.50 | -1.86 | -3.47 | -1.68 | 4.79 | 1.60 | 3.25 | 2.55 | 1.10 | 5.73 |
| 1950 | 1.94 | 0.83 | 0.54 | 2.87 | 2.95 | -6.74 | 2.65 | 3.36 | 5.22 | -1.11 | 1.47 | 6.25 |
| 1951 | 7.08 | 0.64 | -3.07 | 3.29 | -3.24 | -4.51 | 7.89 | 2.48 | 2.10 | -3.22 | 0.29 | 2.18 |
| 1952 | 2.55 | -2.44 | 5.79 | -3.41 | 3.09 | 3.76 | 1.62 | -0.85 | -1.21 | -0.94 | 5.58 | 2.72 |
| 1953 | -0.06 | -1.61 | -1.75 | -2.51 | 0.18 | -1.77 | 2.02 | -5.51 | -0.03 | 3.99 | 1.96 | -1.58 |
| 1954 | 5.22 | 0.69 | 1.85 | 3.70 | 3.55 | 1.57 | 4.54 | -3.48 | 4.84 | -1.72 | 9.45 | 6.05 |
| 1955 | 0.18 | 2.03 | -0.25 | 4.37 | -0.56 | 3.71 | 1.81 | -0.03 | -1.33 | -2.35 | 7.34 | -0.47 |
| 1956 | -2.95 | 2.03 | 5.90 | 0.75 | -5.91 | 2.42 | 4.44 | -3.85 | -4.94 | 1.03 | -1.40 | 4.10 |
| 1957 | -2.40 | -3.10 | 2.04 | 3.06 | 1.44 | -1.04 | 1.16 | -5.26 | -6.06 | -4.50 | 0.52 | -3.01 |
| 1958 | 5.37 | -2.40 | 1.54 | 3.60 | 1.84 | 2.66 | 5.44 | 0.40 | 5.35 | 2.41 | 3.06 | 4.32 |
| 1959 | 1.61 | 1.24 | -0.36 | 2.86 | 1.69 | -0.49 | 3.49 | -1.28 | -4.41 | 0.95 | 0.43 | 2.34 |
| 1960 | -5.66 | 0.75 | -1.80 | -1.90 | 2.16 | 3.18 | -3.42 | 1.76 | -6.90 | 0.28 | 2.99 | 3.26 |
| 1961 | 6.13 | 2.25 | 2.02 | -0.57 | 2.23 | -1.99 | 2.40 | 3.06 | -1.16 | 2.39 | 1.90 | -0.47 |
| 1962 | -2.83 | 1.19 | -0.08 | -4.72 | -8.24 | -7.56 | 6.20 | 2.04 | -4.72 | 1.73 | 10.44 | 1.25 |
| 1963 | 5.09 | -2.05 | 2.56 | 4.86 | 2.24 | -1.74 | -1.71 | 4.71 | -1.13 | 1.20 | -0.11 | 1.65 |
| 1964 | 2.66 | 2.44 | 0.67 | 0.49 | 2.16 | 2.14 | 1.98 | -1.62 | 4.37 | 0.47 | -1.06 | -0.78 |
| 1965 | 3.42 | -0.06 | -0.84 | 2.24 | -1.37 | -5.17 | 2.95 | 2.16 | 3.09 | 3.47 | -0.37 | 1.77 |
| 1966 | 2.16 | -1.80 | -3.73 | 0.98 | -6.66 | -1.47 | -2.12 | -8.46 | -0.90 | 4.98 | -1.13 | -0.06 |
| 1967 | 8.49 | -1.19 | 2.52 | 2.18 | -1.85 | 1.80 | 5.15 | -1.80 | 1.50 | -6.55 | -0.58 | 2.09 |
| 1968 | -3.44 | -1.97 | -1.22 | 7.26 | 1.85 | 1.80 | -2.42 | 0.66 | 4.54 | 0.79 | 4.43 | -3.41 |
| 1969 | 0.84 | -5.67 | -0.01 | 0.13 | -1.47 | -7.40 | -6.55 | 2.15 | -2.89 | 4.44 | -5.82 | -2.68 |
| 1970 | -6.65 | 6.40 | 0.25 | -7.43 | -5.75 | -6.75 | 8.00 | 4.58 | 2.05 | -1.96 | 5.78 | 7.10 |
| 1971 | 5.43 | 0.89 | 2.31 | 5.51 | -3.79 | -0.67 | -3.71 | 6.63 | -1.28 | -3.62 | -1.61 | 7.78 |
| 1972 | 2.25 | 0.90 | 1.01 | 0.38 | 0.01 | -4.88 | -1.02 | 3.63 | -2.33 | 1.36 | 6.62 | -1.46 |
| 1973 | -4.21 | -4.50 | -0.01 | -3.92 | -4.06 | -2.31 | 3.18 | -3.91 | 7.81 | 0.67 | -11.33 | 5.34 |
| 1974 | -0.23 | 1.72 | -3.03 | -4.80 | -4.97 | -0.62 | -4.09 | -10.62 | -8.53 | 12.18 | -5.07 | -0.80 |
| 1975 | 13.84 | 3.41 | 2.17 | 4.45 | 1.38 | 5.05 | -5.71 | -0.44 | -3.72 | 5.91 | 2.34 | -0.06 |
| 1976 | 13.82 | 0.10 | 1.98 | 0.46 | -1.67 | 3.54 | -0.86 | -0.85 | 1.66 | -2.30 | 1.32 | 5.82 |
| 1977 | -3.89 | -2.23 | -0.85 | 2.18 | -1.36 | 2.18 | -2.33 | -4.25 | -0.50 | -3.70 | 2.32 | 0.29 |
| 1978 | -6.20 | -3.15 | 2.50 | 7.88 | -0.03 | -1.98 | 5.79 | 1.71 | -1.21 | -10.10 | 1.33 | -0.54 |
| 1979 | 4.60 | -3.53 | 6.44 | -0.56 | -1.54 | 3.05 | 2.24 | 3.95 | -1.48 | -8.11 | 3.71 | 1.35 |
| 1980 | 6.28 | -0.01 | -10.82 | 3.17 | 5.11 | 2.49 | 7.88 | 0.53 | 0.82 | 2.48 | 10.45 | -3.97 |
| 1981 | -0.82 | -0.09 | 5.62 | -1.65 | 0.72 | -2.28 | -1.77 | -6.66 | -4.82 | 3.16 | 4.91 | -2.68 |
| 1982 | -2.46 | -4.63 | -0.25 | 3.37 | -4.17 | -0.96 | -1.92 | 12.94 | -0.30 | 11.25 | 4.07 | 1.05 |
| 1983 | 3.14 | 3.86 | 1.78 | 6.25 | -0.28 | 3.48 | -2.67 | 0.69 | 2.02 | 1.07 | 3.36 | -1.53 |
| 1984 | -3.87 | -5.89 | 0.37 | -0.59 | -5.20 | 2.08 | -1.12 | 9.13 | 0.01 | 0.99 | -0.95 | 3.30 |
| 1985 | 5.93 | 0.88 | -1.61 | -1.67 | 6.93 | 1.81 | 0.97 | -0.42 | -3.15 | 3.14 | 6.40 | 4.63 |
| 1986 | 2.59 | 7.44 | 5.67 | -3.41 | 4.18 | 0.59 | -5.55 | 7.24 | -4.47 | 5.49 | 1.70 | -2.37 |
| 1987 | 11.58 | 3.29 | 1.22 | -1.17 | 1.52 | 5.26 | 4.80 | 1.97 | -2.44 | -22.63 | -7.35 | 5.29 |
| 1988 | 2.40 | 5.24 | -2.45 | 0.54 | -0.09 | 6.27 | -0.90 | -4.20 | 4.52 | 2.01 | -0.72 | 2.53 |
| 1989 | 7.89 | -3.17 | 1.24 | 6.01 | 2.22 | -0.29 | 9.21 | 6.71 | -2.22 | -6.29 | 0.85 | 1.84 |
| 1990 | -7.30 | 2.76 | 2.64 | -3.20 | 6.17 | -0.87 | -0.80 | -11.63 | -5.05 | 0.51 | 3.51 | 3.12 |
| 1991 | 6.61 | 5.08 | 0.35 | -0.14 | 5.05 | -5.10 | 4.40 | 0.58 | -0.66 | 3.28 | -5.52 | 10.29 |
| 1992 | -0.11 | 2.07 | -1.50 | 2.31 | 0.72 | -2.65 | 2.28 | -4.82 | 1.67 | 0.92 | 2.66 | 0.80 |
| 1993 | 1.77 | 2.14 | 2.17 | 0.21 | 1.16 | -0.32 | 1.96 | 3.08 | -2.50 | 3.21 | -0.33 | 1.35 |
| 1994 | 4.78 | -4.59 | -6.00 | 1.40 | -0.38 | -3.17 | 2.54 | 3.47 | -4.53 | 1.67 | -4.25 | 1.81 |
| 1995 | 1.81 | 4.56 | 2.34 | 3.63 | 2.19 | 2.44 | 4.56 | -1.06 | 3.76 | -0.67 | 5.98 | -0.51 |
| 1996 | 2.75 | 1.98 | 2.25 | 0.49 | 1.06 | 0.07 | -4.47 | 1.99 | 3.44 | 2.77 | 7.44 | -1.27 |
| 1997 | 4.27 | 0.24 | -2.65 | 6.30 | 4.23 | 3.33 | 7.57 | -5.58 | 5.94 | -3.66 | 4.45 | 2.03 |
| 1998 | -0.10 | 5.43 | 4.28 | 0.99 | -2.34 | 1.88 | -3.19 | -12.70 | 3.22 | 7.23 | 4.80 | 1.75 |
| 1999 | 0.99 | -0.80 | 3.65 | 9.70 | -1.69 | 1.49 | -2.31 | -0.61 | -4.90 | 3.89 | -1.49 | 4.24 |
| 2000 | -3.99 | -7.55 | 7.99 | 0.86 | -1.60 | -2.20 | 3.11 | 5.38 | -2.33 | 3.00 | -3.18 | 4.81 |
| 2001 | -0.65 | -2.57 | -4.71 | 6.18 | 1.64 | -4.80 | 0.08 | -4.35 | -13.62 | 0.99 | 6.95 | 3.02 |
| 2002 | 0.14 | 0.76 | 4.36 | -4.17 | -0.95 | -5.10 | -8.90 | -1.06 | -10.55 | 5.75 | 5.03 | -3.34 |
| 2003 | -4.07 | -3.41 | 2.61 | 8.19 | 4.94 | 0.50 | 2.57 | 1.99 | -0.14 | 5.64 | -0.19 | 5.74 |
| 2004 | -0.55 | 1.07 | -1.05 | -1.29 | 0.47 | 3.80 | -2.15 | 0.71 | 1.02 | 3.06 | 4.17 | 3.41 |
| 2005 | -2.49 | 2.93 | -1.02 | -3.05 | 2.41 | -0.55 | 4.90 | -1.06 | 2.36 | -1.69 | 3.99 | 0.55 |
| 2006 | 2.43 | 1.02 | 0.32 | 2.22 | -0.36 | 2.21 | -2.78 | 0.56 | 1.76 | 4.52 | 0.92 | -0.11 |
| 2007 | 2.88 | -0.61 | 0.92 | 4.99 | 3.72 | -2.87 | -1.91 | -0.17 | 2.42 | 1.95 | -3.53 | -0.95 |
| 2008 | -2.35 | -3.77 | 1.64 | 6.06 | 1.42 | -7.81 | -0.57 | 0.58 | -8.00 | -14.17 | -5.43 | -0.71 |
| 2009 | -9.32 | -13.00 | 6.26 | 8.78 | 3.00 | 0.93 | 8.10 | 2.73 | 2.43 | -2.16 | 6.84 | 2.53 |
| 2010 | -4.19 | 2.56 | 4.97 | 3.14 | -7.52 | -4.33 | 8.16 | -4.11 | 7.28 | 3.42 | -0.48 | 4.89 |
| 2011 | 1.10 | 2.10 | 1.57 | 3.99 | -0.96 | -1.04 | -2.56 | -5.06 | -6.12 | 10.32 | 0.66 | 1.84 |
| 2012 | 2.91 | 0.47 | 1.94 | 0.32 | -4.27 | 3.36 | 0.33 | -1.10 | 1.10 | -0.20 | -1.12 | 1.34 |
| Totals | 103.11 | -2.82 | 27.14 | 105.37 | 2.50 | 29.48 | 100.66 | -20.82 | -39.28 | 59.39 | 72.40 | 134.28 |
| Ave (+/-) | 1.31 | -0.04 | 0.34 | 1.33 | 0.03 | 0.37 | 1.27 | -0.26 | -0.50 | 0.75 | 0.92 | 1.70 |
| 5.56 | ||||||||||||
| Total Return May to Oct | 1.67 | |||||||||||
| Dow Jones Composite Monthly Returns 1975 - 2012 | ||||||||||||
| Jan | Feb | Mar | April | May | June | July | Aug | Sept | Oct | Nov | Dec | |
| 1975 | 13.84 | 3.41 | 2.17 | 4.45 | 1.38 | 5.05 | -5.71 | -0.44 | -3.72 | 5.91 | 2.34 | -0.06 |
| 1976 | 13.82 | 0.10 | 1.98 | 0.46 | -1.67 | 3.54 | -0.86 | -0.85 | 1.66 | -2.30 | 1.32 | 5.82 |
| 1977 | -3.89 | -2.23 | -0.85 | 2.18 | -1.36 | 2.18 | -2.33 | -4.25 | -0.50 | -3.70 | 2.32 | 0.29 |
| 1978 | -6.20 | -3.15 | 2.50 | 7.88 | -0.03 | -1.98 | 5.79 | 1.71 | -1.21 | -10.10 | 1.33 | -0.54 |
| 1979 | 4.60 | -3.53 | 6.44 | -0.56 | -1.54 | 3.05 | 2.24 | 3.95 | -1.48 | -8.11 | 3.71 | 1.35 |
| 1980 | 6.28 | -0.01 | -10.82 | 3.17 | 5.11 | 2.49 | 7.88 | 0.53 | 0.82 | 2.48 | 10.45 | -3.97 |
| 1981 | -0.82 | -0.09 | 5.62 | -1.65 | 0.72 | -2.28 | -1.77 | -6.66 | -4.82 | 3.16 | 4.91 | -2.68 |
| 1982 | -2.46 | -4.63 | -0.25 | 3.37 | -4.17 | -0.96 | -1.92 | 12.94 | -0.30 | 11.25 | 4.07 | 1.05 |
| 1983 | 3.14 | 3.86 | 1.78 | 6.25 | -0.28 | 3.48 | -2.67 | 0.69 | 2.02 | 1.07 | 3.36 | -1.53 |
| 1984 | -3.87 | -5.89 | 0.37 | -0.59 | -5.20 | 2.08 | -1.12 | 9.13 | 0.01 | 0.99 | -0.95 | 3.30 |
| 1985 | 5.93 | 0.88 | -1.61 | -1.67 | 6.93 | 1.81 | 0.97 | -0.42 | -3.15 | 3.14 | 6.40 | 4.63 |
| 1986 | 2.59 | 7.44 | 5.67 | -3.41 | 4.18 | 0.59 | -5.55 | 7.24 | -4.47 | 5.49 | 1.70 | -2.37 |
| 1987 | 11.58 | 3.29 | 1.22 | -1.17 | 1.52 | 5.26 | 4.80 | 1.97 | -2.44 | -22.63 | -7.35 | 5.29 |
| 1988 | 2.40 | 5.24 | -2.45 | 0.54 | -0.09 | 6.27 | -0.90 | -4.20 | 4.52 | 2.01 | -0.72 | 2.53 |
| 1989 | 7.89 | -3.17 | 1.24 | 6.01 | 2.22 | -0.29 | 9.21 | 6.71 | -2.22 | -6.29 | 0.85 | 1.84 |
| 1990 | -7.30 | 2.76 | 2.64 | -3.20 | 6.17 | -0.87 | -0.80 | -11.63 | -5.05 | 0.51 | 3.51 | 3.12 |
| 1991 | 6.61 | 5.08 | 0.35 | -0.14 | 5.05 | -5.10 | 4.40 | 0.58 | -0.66 | 3.28 | -5.52 | 10.29 |
| 1992 | -0.11 | 2.07 | -1.50 | 2.31 | 0.72 | -2.65 | 2.28 | -4.82 | 1.67 | 0.92 | 2.66 | 0.80 |
| 1993 | 1.77 | 2.14 | 2.17 | 0.21 | 1.16 | -0.32 | 1.96 | 3.08 | -2.50 | 3.21 | -0.33 | 1.35 |
| 1994 | 4.78 | -4.59 | -6.00 | 1.40 | -0.38 | -3.17 | 2.54 | 3.47 | -4.53 | 1.67 | -4.25 | 1.81 |
| 1995 | 1.81 | 4.56 | 2.34 | 3.63 | 2.19 | 2.44 | 4.56 | -1.06 | 3.76 | -0.67 | 5.98 | -0.51 |
| 1996 | 2.75 | 1.98 | 2.25 | 0.49 | 1.06 | 0.07 | -4.47 | 1.99 | 3.44 | 2.77 | 7.44 | -1.27 |
| 1997 | 4.27 | 0.24 | -2.65 | 6.30 | 4.23 | 3.33 | 7.57 | -5.58 | 5.94 | -3.66 | 4.45 | 2.03 |
| 1998 | -0.10 | 5.43 | 4.28 | 0.99 | -2.34 | 1.88 | -3.19 | -12.70 | 3.22 | 7.23 | 4.80 | 1.75 |
| 1999 | 0.99 | -0.80 | 3.65 | 9.70 | -1.69 | 1.49 | -2.31 | -0.61 | -4.90 | 3.89 | -1.49 | 4.24 |
| 2000 | -3.99 | -7.55 | 7.99 | 0.86 | -1.60 | -2.20 | 3.11 | 5.38 | -2.33 | 3.00 | -3.18 | 4.81 |
| 2001 | -0.65 | -2.57 | -4.71 | 6.18 | 1.64 | -4.80 | 0.08 | -4.35 | -13.62 | 0.99 | 6.95 | 3.02 |
| 2002 | 0.14 | 0.76 | 4.36 | -4.17 | -0.95 | -5.10 | -8.90 | -1.06 | -10.55 | 5.75 | 5.03 | -3.34 |
| 2003 | -4.07 | -3.41 | 2.61 | 8.19 | 4.94 | 0.50 | 2.57 | 1.99 | -0.14 | 5.64 | -0.19 | 5.74 |
| 2004 | -0.55 | 1.07 | -1.05 | -1.29 | 0.47 | 3.80 | -2.15 | 0.71 | 1.02 | 3.06 | 4.17 | 3.41 |
| 2005 | -2.49 | 2.93 | -1.02 | -3.05 | 2.41 | -0.55 | 4.90 | -1.06 | 2.36 | -1.69 | 3.99 | 0.55 |
| 2006 | 2.43 | 1.02 | 0.32 | 2.22 | -0.36 | 2.21 | -2.78 | 0.56 | 1.76 | 4.52 | 0.92 | -0.11 |
| 2007 | 2.88 | -0.61 | 0.92 | 4.99 | 3.72 | -2.87 | -1.91 | -0.17 | 2.42 | 1.95 | -3.53 | -0.95 |
| 2008 | -2.35 | -3.77 | 1.64 | 6.06 | 1.42 | -7.81 | -0.57 | 0.58 | -8.00 | -14.17 | -5.43 | -0.71 |
| 2009 | -9.32 | -13.00 | 6.26 | 8.78 | 3.00 | 0.93 | 8.10 | 2.73 | 2.43 | -2.16 | 6.84 | 2.53 |
| 2010 | -4.19 | 2.56 | 4.97 | 3.14 | -7.52 | -4.33 | 8.16 | -4.11 | 7.28 | 3.42 | -0.48 | 4.89 |
| 2011 | 1.10 | 2.10 | 1.57 | 3.99 | -0.96 | -1.04 | -2.56 | -5.06 | -6.12 | 10.32 | 0.66 | 1.84 |
| 2012 | 2.91 | 0.47 | 1.94 | 0.32 | -4.27 | 3.36 | 0.33 | -1.10 | 1.10 | -0.20 | -1.12 | 1.34 |
| Totals | 52.15 | 0.39 | 46.34 | 83.17 | 25.83 | 9.49 | 28.98 | -4.19 | -37.28 | 21.95 | 65.62 | 61.58 |
| Ave (+/-) | 1.37 | 0.01 | 1.22 | 2.19 | 0.68 | 0.25 | 0.76 | -0.11 | -0.98 | 0.58 | 1.73 | 1.62 |
| 8.14 | ||||||||||||
| Total Return May to Oct | 1.18 | |||||||||||
| Dow Jones Composite Monthly Returns 1934 - 1974 | ||||||||||||
| Jan | Feb | Mar | April | May | June | July | Aug | Sept | Oct | Nov | Dec | |
| 1934 | 12.33 | -3.42 | -1.05 | -1.69 | -7.85 | 2.52 | -13.16 | 4.85 | -0.08 | -1.62 | 7.34 | -0.40 |
| 1935 | -3.66 | -3.00 | -2.15 | 8.60 | 2.59 | 7.10 | 7.21 | 2.02 | 1.55 | 5.22 | 4.03 | 2.04 |
| 1936 | 6.76 | 2.21 | 0.70 | -7.34 | 5.74 | 3.34 | 6.76 | 1.07 | 0.72 | 5.48 | 0.41 | -2.27 |
| 1937 | 3.04 | 1.06 | 0.43 | -6.54 | -1.15 | -5.17 | 8.60 | -5.49 | -13.57 | -11.25 | -8.46 | -4.75 |
| 1938 | -1.34 | 6.06 | -26.25 | 13.15 | -2.96 | 28.76 | 5.37 | -2.37 | 0.66 | 11.03 | -2.93 | 5.40 |
| 1939 | -7.29 | 4.65 | -12.81 | -1.97 | 8.00 | -5.87 | 10.67 | -6.92 | 16.21 | -1.00 | -4.49 | 2.53 |
| 1940 | -3.44 | 0.51 | 1.16 | 0.08 | -22.61 | 8.11 | 2.93 | 2.36 | 1.73 | 2.27 | -4.28 | 0.11 |
| 1941 | -3.80 | -1.76 | 1.38 | -5.16 | -1.21 | 5.68 | 5.23 | -0.80 | -1.36 | -6.21 | -3.75 | -4.18 |
| 1942 | 1.22 | -2.30 | -8.24 | -3.76 | 3.97 | 2.12 | 2.86 | 0.88 | 3.29 | 5.59 | -1.42 | 3.72 |
| 1943 | 6.26 | 5.11 | 5.22 | 1.12 | 4.80 | 0.53 | -5.02 | 0.59 | 2.41 | -0.76 | -7.14 | 5.25 |
| 1944 | 2.93 | 1.01 | 1.96 | -1.96 | 4.29 | 3.78 | 0.70 | -1.13 | -0.27 | 0.53 | 1.14 | 5.78 |
| 1945 | 0.02 | 5.91 | -4.52 | 8.90 | 1.67 | 1.04 | -2.70 | 3.39 | 5.11 | 2.82 | 3.91 | -0.25 |
| 1946 | 6.80 | -7.16 | 4.90 | 2.55 | 3.17 | -3.13 | -3.04 | -6.40 | -11.31 | -0.18 | 0.60 | 4.15 |
| 1947 | 0.85 | -0.80 | -1.81 | -4.74 | -1.12 | 4.49 | 4.62 | -2.03 | -0.76 | 1.48 | -2.43 | 3.32 |
| 1948 | -2.75 | -4.25 | 6.53 | 3.55 | 5.29 | 0.44 | -4.02 | 0.80 | -2.63 | 5.12 | -10.63 | 3.04 |
| 1949 | 1.04 | -4.25 | 2.50 | -1.86 | -3.47 | -1.68 | 4.79 | 1.60 | 3.25 | 2.55 | 1.10 | 5.73 |
| 1950 | 1.94 | 0.83 | 0.54 | 2.87 | 2.95 | -6.74 | 2.65 | 3.36 | 5.22 | -1.11 | 1.47 | 6.25 |
| 1951 | 7.08 | 0.64 | -3.07 | 3.29 | -3.24 | -4.51 | 7.89 | 2.48 | 2.10 | -3.22 | 0.29 | 2.18 |
| 1952 | 2.55 | -2.44 | 5.79 | -3.41 | 3.09 | 3.76 | 1.62 | -0.85 | -1.21 | -0.94 | 5.58 | 2.72 |
| 1953 | -0.06 | -1.61 | -1.75 | -2.51 | 0.18 | -1.77 | 2.02 | -5.51 | -0.03 | 3.99 | 1.96 | -1.58 |
| 1954 | 5.22 | 0.69 | 1.85 | 3.70 | 3.55 | 1.57 | 4.54 | -3.48 | 4.84 | -1.72 | 9.45 | 6.05 |
| 1955 | 0.18 | 2.03 | -0.25 | 4.37 | -0.56 | 3.71 | 1.81 | -0.03 | -1.33 | -2.35 | 7.34 | -0.47 |
| 1956 | -2.95 | 2.03 | 5.90 | 0.75 | -5.91 | 2.42 | 4.44 | -3.85 | -4.94 | 1.03 | -1.40 | 4.10 |
| 1957 | -2.40 | -3.10 | 2.04 | 3.06 | 1.44 | -1.04 | 1.16 | -5.26 | -6.06 | -4.50 | 0.52 | -3.01 |
| 1958 | 5.37 | -2.40 | 1.54 | 3.60 | 1.84 | 2.66 | 5.44 | 0.40 | 5.35 | 2.41 | 3.06 | 4.32 |
| 1959 | 1.61 | 1.24 | -0.36 | 2.86 | 1.69 | -0.49 | 3.49 | -1.28 | -4.41 | 0.95 | 0.43 | 2.34 |
| 1960 | -5.66 | 0.75 | -1.80 | -1.90 | 2.16 | 3.18 | -3.42 | 1.76 | -6.90 | 0.28 | 2.99 | 3.26 |
| 1961 | 6.13 | 2.25 | 2.02 | -0.57 | 2.23 | -1.99 | 2.40 | 3.06 | -1.16 | 2.39 | 1.90 | -0.47 |
| 1962 | -2.83 | 1.19 | -0.08 | -4.72 | -8.24 | -7.56 | 6.20 | 2.04 | -4.72 | 1.73 | 10.44 | 1.25 |
| 1963 | 5.09 | -2.05 | 2.56 | 4.86 | 2.24 | -1.74 | -1.71 | 4.71 | -1.13 | 1.20 | -0.11 | 1.65 |
| 1964 | 2.66 | 2.44 | 0.67 | 0.49 | 2.16 | 2.14 | 1.98 | -1.62 | 4.37 | 0.47 | -1.06 | -0.78 |
| 1965 | 3.42 | -0.06 | -0.84 | 2.24 | -1.37 | -5.17 | 2.95 | 2.16 | 3.09 | 3.47 | -0.37 | 1.77 |
| 1966 | 2.16 | -1.80 | -3.73 | 0.98 | -6.66 | -1.47 | -2.12 | -8.46 | -0.90 | 4.98 | -1.13 | -0.06 |
| 1967 | 8.49 | -1.19 | 2.52 | 2.18 | -1.85 | 1.80 | 5.15 | -1.80 | 1.50 | -6.55 | -0.58 | 2.09 |
| 1968 | -3.44 | -1.97 | -1.22 | 7.26 | 1.85 | 1.80 | -2.42 | 0.66 | 4.54 | 0.79 | 4.43 | -3.41 |
| 1969 | 0.84 | -5.67 | -0.01 | 0.13 | -1.47 | -7.40 | -6.55 | 2.15 | -2.89 | 4.44 | -5.82 | -2.68 |
| 1970 | -6.65 | 6.40 | 0.25 | -7.43 | -5.75 | -6.75 | 8.00 | 4.58 | 2.05 | -1.96 | 5.78 | 7.10 |
| 1971 | 5.43 | 0.89 | 2.31 | 5.51 | -3.79 | -0.67 | -3.71 | 6.63 | -1.28 | -3.62 | -1.61 | 7.78 |
| 1972 | 2.25 | 0.90 | 1.01 | 0.38 | 0.01 | -4.88 | -1.02 | 3.63 | -2.33 | 1.36 | 6.62 | -1.46 |
| 1973 | -4.21 | -4.50 | -0.01 | -3.92 | -4.06 | -2.31 | 3.18 | -3.91 | 7.81 | 0.67 | -11.33 | 5.34 |
| 1974 | -0.23 | 1.72 | -3.03 | -4.80 | -4.97 | -0.62 | -4.09 | -10.62 | -8.53 | 12.18 | -5.07 | -0.80 |
| Totals | 50.96 | -3.21 | -19.20 | 22.20 | -23.33 | 19.99 | 71.68 | -16.63 | -2.00 | 37.44 | 6.78 | 72.70 |
| Ave (+/-) | 1.24 | -0.08 | -0.47 | 0.54 | -0.57 | 0.49 | 1.75 | -0.41 | -0.05 | 0.91 | 0.17 | 1.77 |
| Total Return Nov to April | 3.18 | |||||||||||
| Total Return May to Oct | 2.13 | |||||||||||
In summary from 1934 to 2012 the difference of return is 5.56 - 1.67 or 3.89%. Frankly I was suprised when I saw this number. I knew there was a difference but I did not expect it to be so large. The real question is (or was) the return difference exploitable? Pre-1975 I seem to remember reading that the commissions were around 3%. If you are inning and outing of the market every May 1st and November 1st there would have been significant costs back pre-1975. I doubt very much that a calendar based strategy would have worked pre-1975. Pre-1975 the return difference is only 3.18 - 2.13 or 1.05%.
If we look at the return profile from 1975 to 2012 we see that the return difference is 8.14 - 1.18 or 6.96%. This is a significant number in my opinion. For some reason the calendar return difference has gone up a lot. We do know that post 1975 commissions declined significantly and market turnover increased. We do have to be careful here - this is not a rigorous statistical study. A few extreme data points in our sample might move the numbers quite a bit.
Now, what about causation? To be honest I do not know what would cause such a large return differential (market index only). I can speculate as to the reasons but i will refrain from doing so. Maybe some of my readers can provide some further information.
So the real question is can someone in and out of the market May and November and acheive superior returns? I still believe that big money cannot benefit from this anomoly.There is too much market impact at May 1st or November 1st to make this an exploitable strategy. Can a small investor exploit this anomoly? This is more interesting. Although the data does seem to suggest some anomoly is going on I think a deeper statistical work complete with causation analysis would need to be done.
Currently I would not employ such a strategy even though the data is compelling.
Subscribe to:
Comments (Atom)